A Straightforward Model for Estimating Your Likelihood of Recovery After a Google Algorithm Update


I polled my audience on social media a few months ago with what I thought was an interesting question: which of the following three scenarios is the most difficult for an SEO?
- Growing SEO traffic
- Retaining SEO traffic
- Recovering SEO traffic
Of the 57 votes I received (49 on Twitter, and 8 on LinkedIn), nearly 60% of respondents said that recovering SEO traffic was the most difficult.
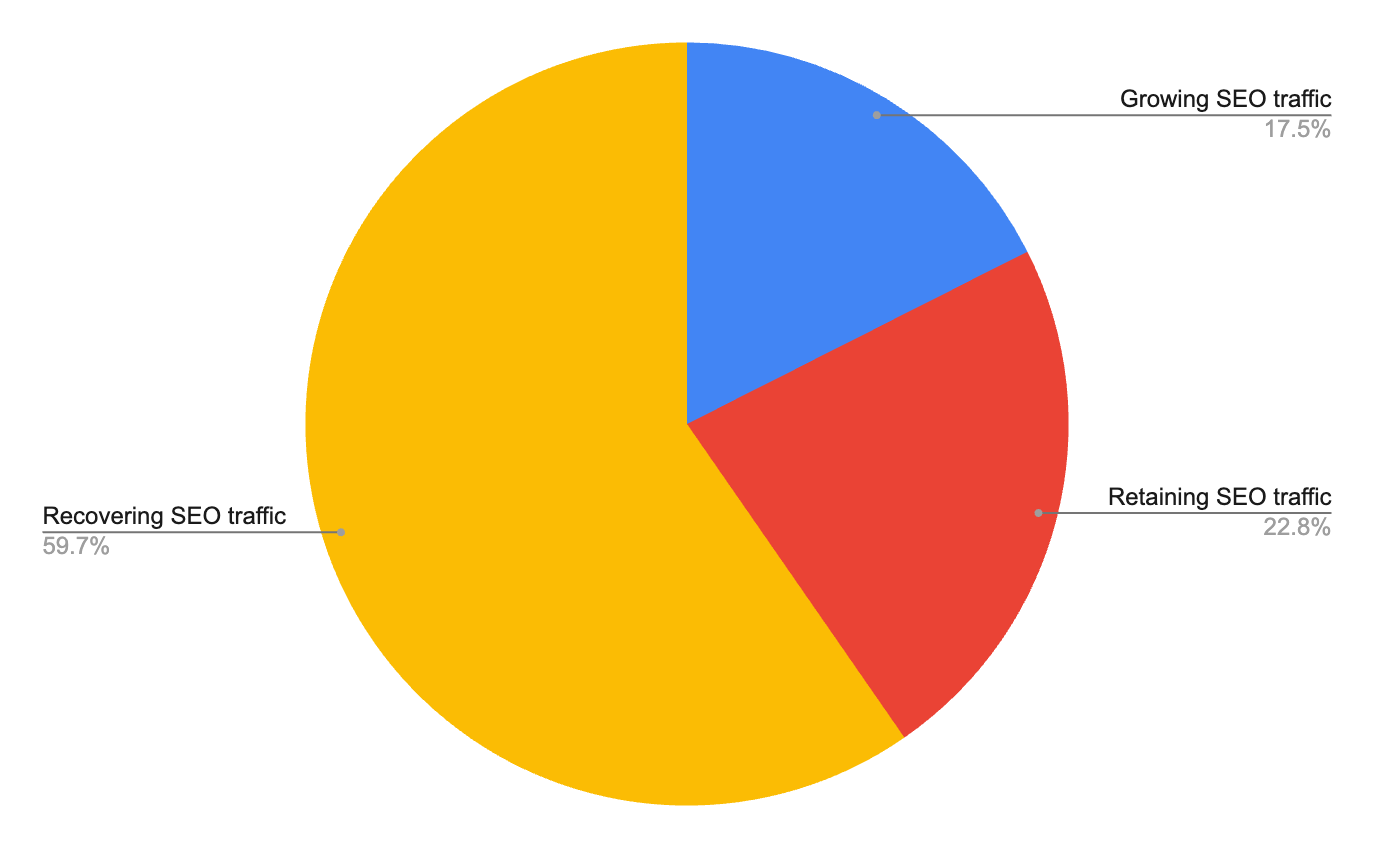
I wasn't surprised that that option came out on top, although I was surprised by how much it pulled away from the other two options.
I recently spoke with someone whose site has experienced substantial traffic losses from the three-pack of algorithm updates starting in August of 2023. It's not the worst case I've seen, but it's been a substantial loss for her business and getting worse by the month.
She asked me, "how much of this traffic do you think is recoverable?"
The truth is this is a tricky question to give a concrete answer to, mainly because of how many variables there are, including (to name a few):
-What the SERPs look like for the keywords you either dropped/lost coverage completely for
-Your own site's E-E-A-T and domain authority
-How much time and effort you can commit to crafting (or re-crafting content) to make it more helpful for users
However, as I mentioned in the Recovery Scorecard post, there are a few commonalities between websites that have lost traffic that we can use to estimate a reasonable range of traffic recovery rates.
So I've put together another tool you can use to get such a range for recovery, from pessimistic to optimistic, based on four key factors:
- Severity of Update Impact (represented as S)
- Keyword Total Losses (represented as L)
- Average Keyword Competitiveness (represented as C)
- Domain Authority (represented as DA)
Like the Scorecard, I designed this primarily for ease of use as a top-line assessment that someone can take a website through relatively quickly. It's not designed to replace a full-fledged audit, and as with any projection, your mileage will vary as far as its effectiveness.
Use them in tandem: the scorecard to get a more qualitative sense of how likely your site is to recover and this traffic reclamation scenario calculator to give it a finer numeric estimate.

You'll need access to your favorite keyword tool (Ahrefs, SEMRush, etc.) to pull Keyword Difficulty and Domain Authority scores. I'll use Ahrefs for the example screenshots because it's the tool I use most often.
Let's start by defining the factors:
Factors
Severity of Update Impact is defined as the impact of whatever algorithm updates took place in a given time period on site-wide traffic. If you went through the Scorecard exercise in my previous post, use a time period that maps to the update(s) you think you were most affected by. That way, you can get a clear sense of before and after.
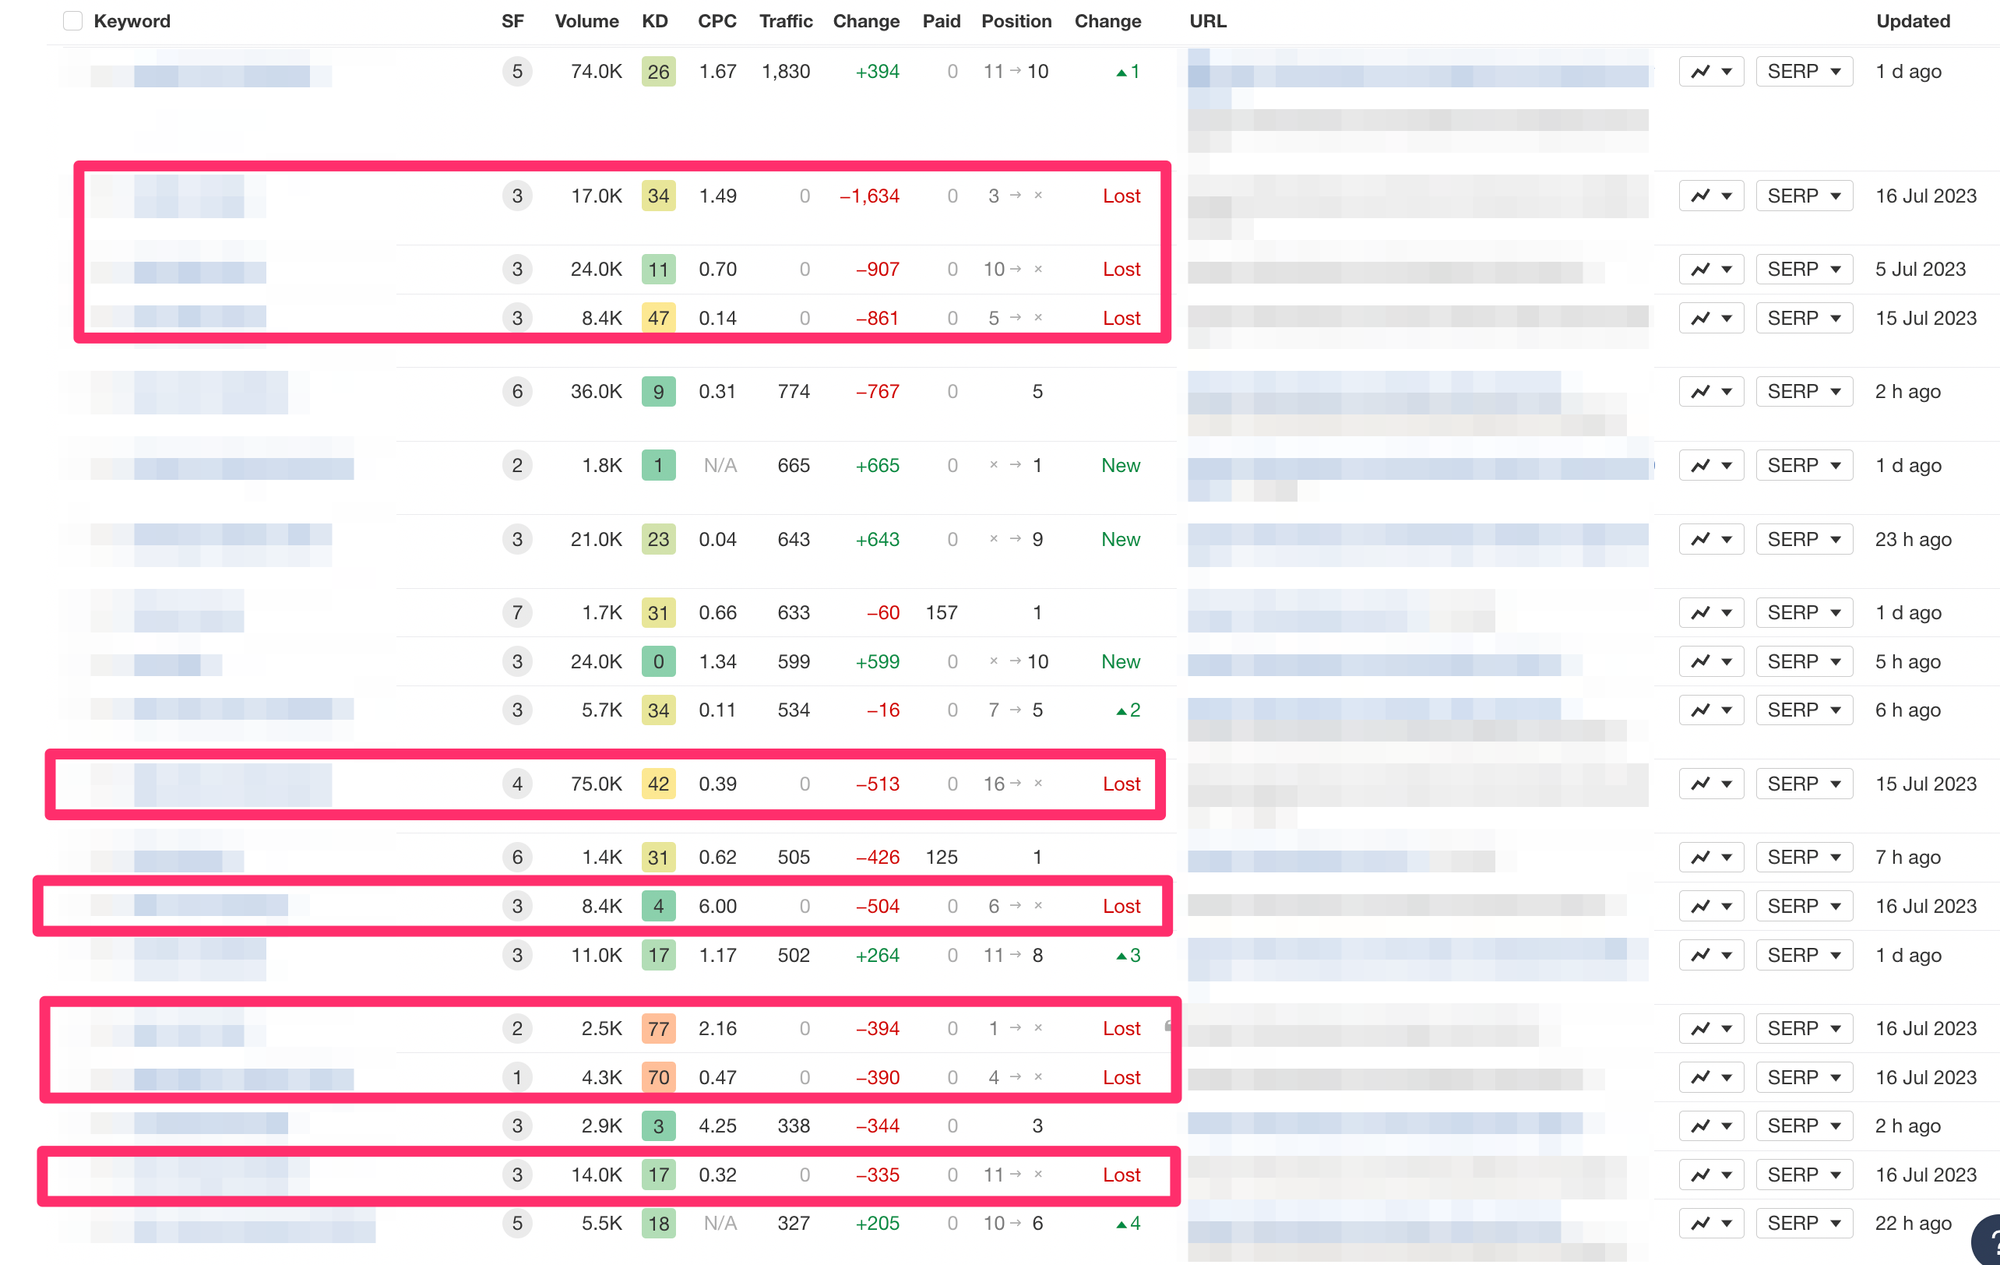
Keyword Total Losses is defined here as the total number of keywords that were driving traffic to your web site in the previous period where now your page is no longer visible. This contrasts with situations where your page has simply lost a few spots or even many spots for a keyword. The data here is easy to pull with Ahrefs: export the data from the Organic Keywords report to Sheets (or Excel) and filter by 'Lost' in the Position Change column.
Average Keyword Competitiveness is the average Keyword Difficulty score of the top keywords driving traffic the previous year. This factor is also intentionally weighted far less than the first two, given the accuracy of keyword difficulty scores (and their variability across the different SEO tools).
And finally Domain Authority, which measures the strength of the domain: a significant factor impacting your likelihood to recover traffic.
The formulas themselves are as follows:
Conservative Scenario
Rconservative = 0.5 + 0.15DA − 0.4S − 0.3L − 0.1C
Moderate Scenario
Rmoderate = 0.5 + 0.2DA − 0.35S − 0.25L − 0.1C
Optimistic Scenario
Roptimistic = 0.5 + 0.25DA − 0.3S − 0.2L − 0.1C
You can do the math yourself (substituting each variable's value with your own) or you can use this spreadsheet to plug in your variables and get the different scenarios.
Example 1:
Let's go through an example with a financial content site that I consider high on the YMYL spectrum. Traffic-wise, they're down 87% site-wide from a year ago, which is a massive drop. So for our formula, S will equal 0.87. That's the first factor.

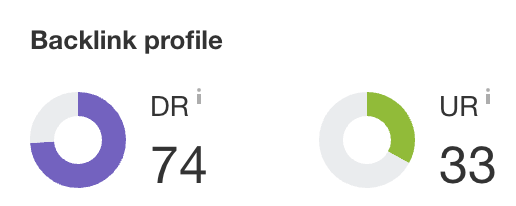
Let's next pull the Domain Authority. It's 74 out of 100, which is fairly strong, although it competes with some of the most authoritative publishers in finance. We'll represent that number in the formula as 0.74. (Remember, all of these will live on a 0-1 scale).
The second metric will show us how many keywords have been lost entirely over the last year. We'll go to the Organic Keywords report in Ahrefs and export the top 1000 keywords for the domain into Google Sheets.
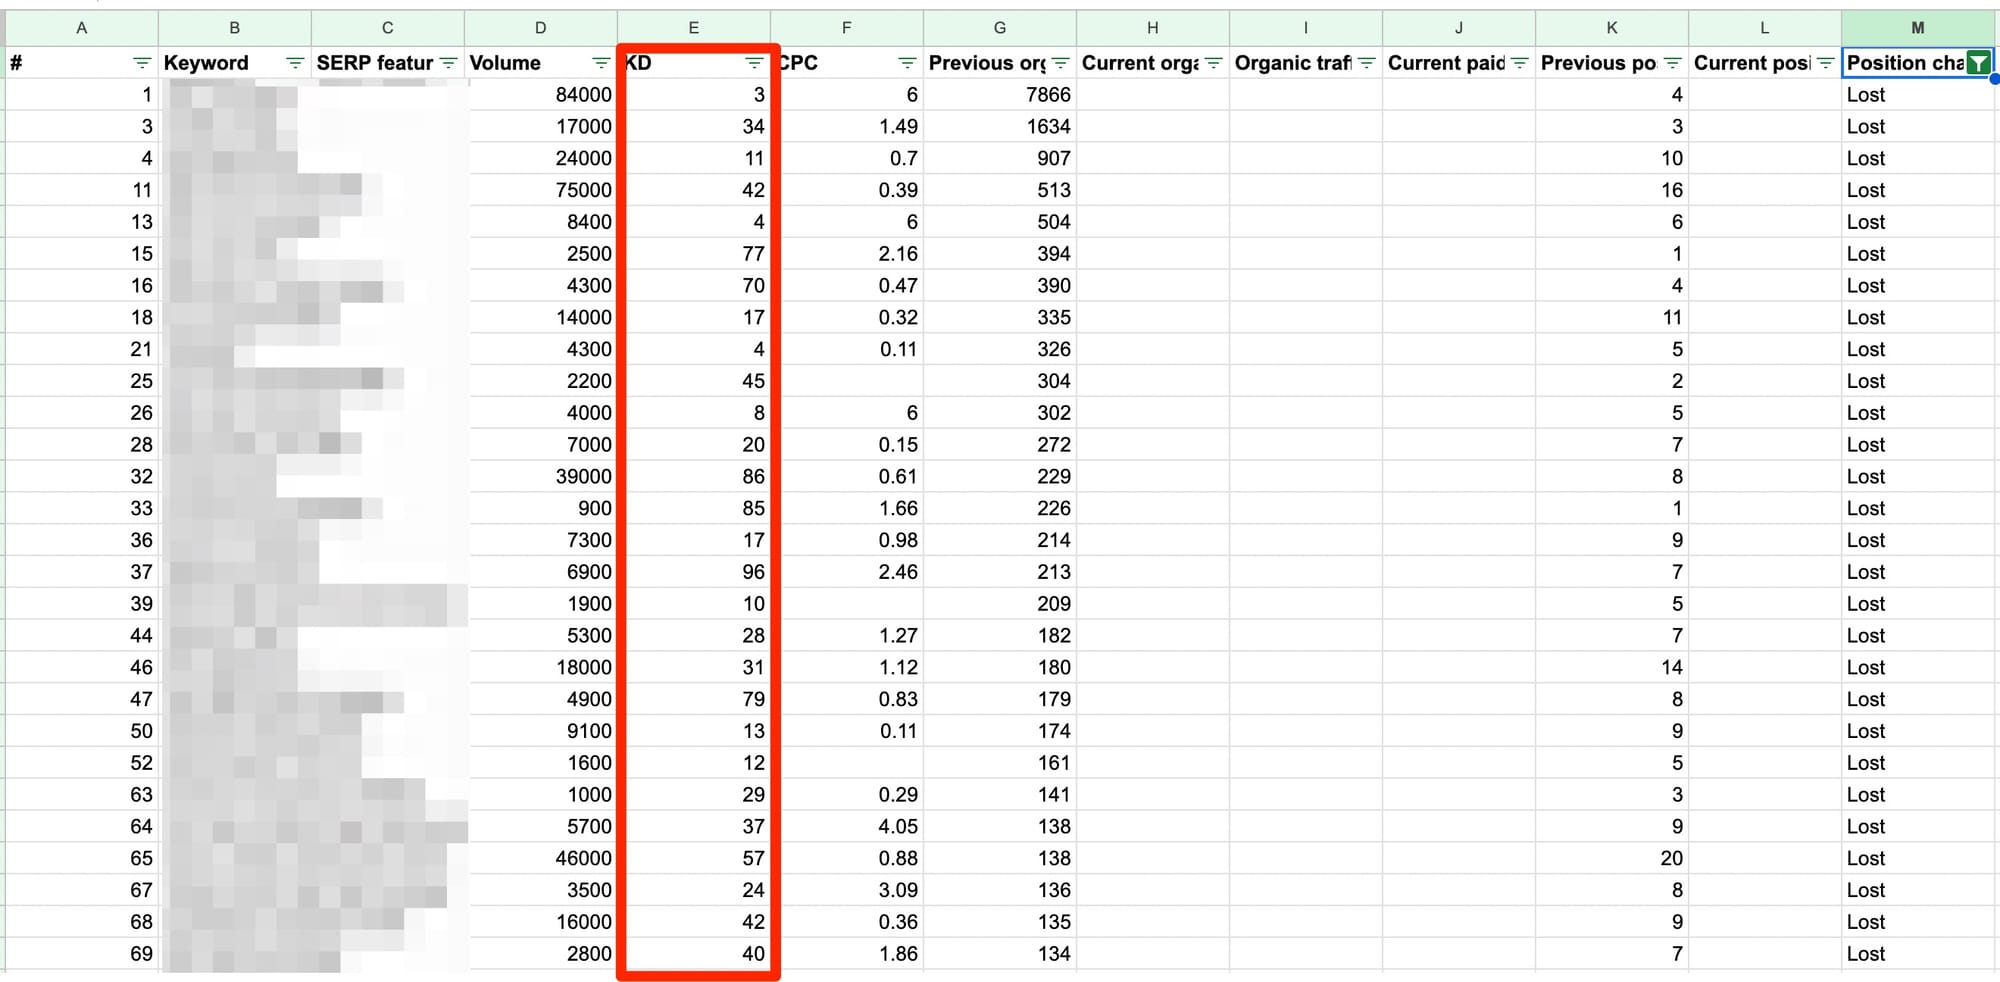
Next, we'll sort the keywords from high to low based on Column G ('Previous Organic Traffic'), move over to Column M, and filter by 'Lost.' This will give us a hard count of how many keywords have been lost. The percentage of keywords lost relative to the total (we'll use the top 1000), represents the final value here.
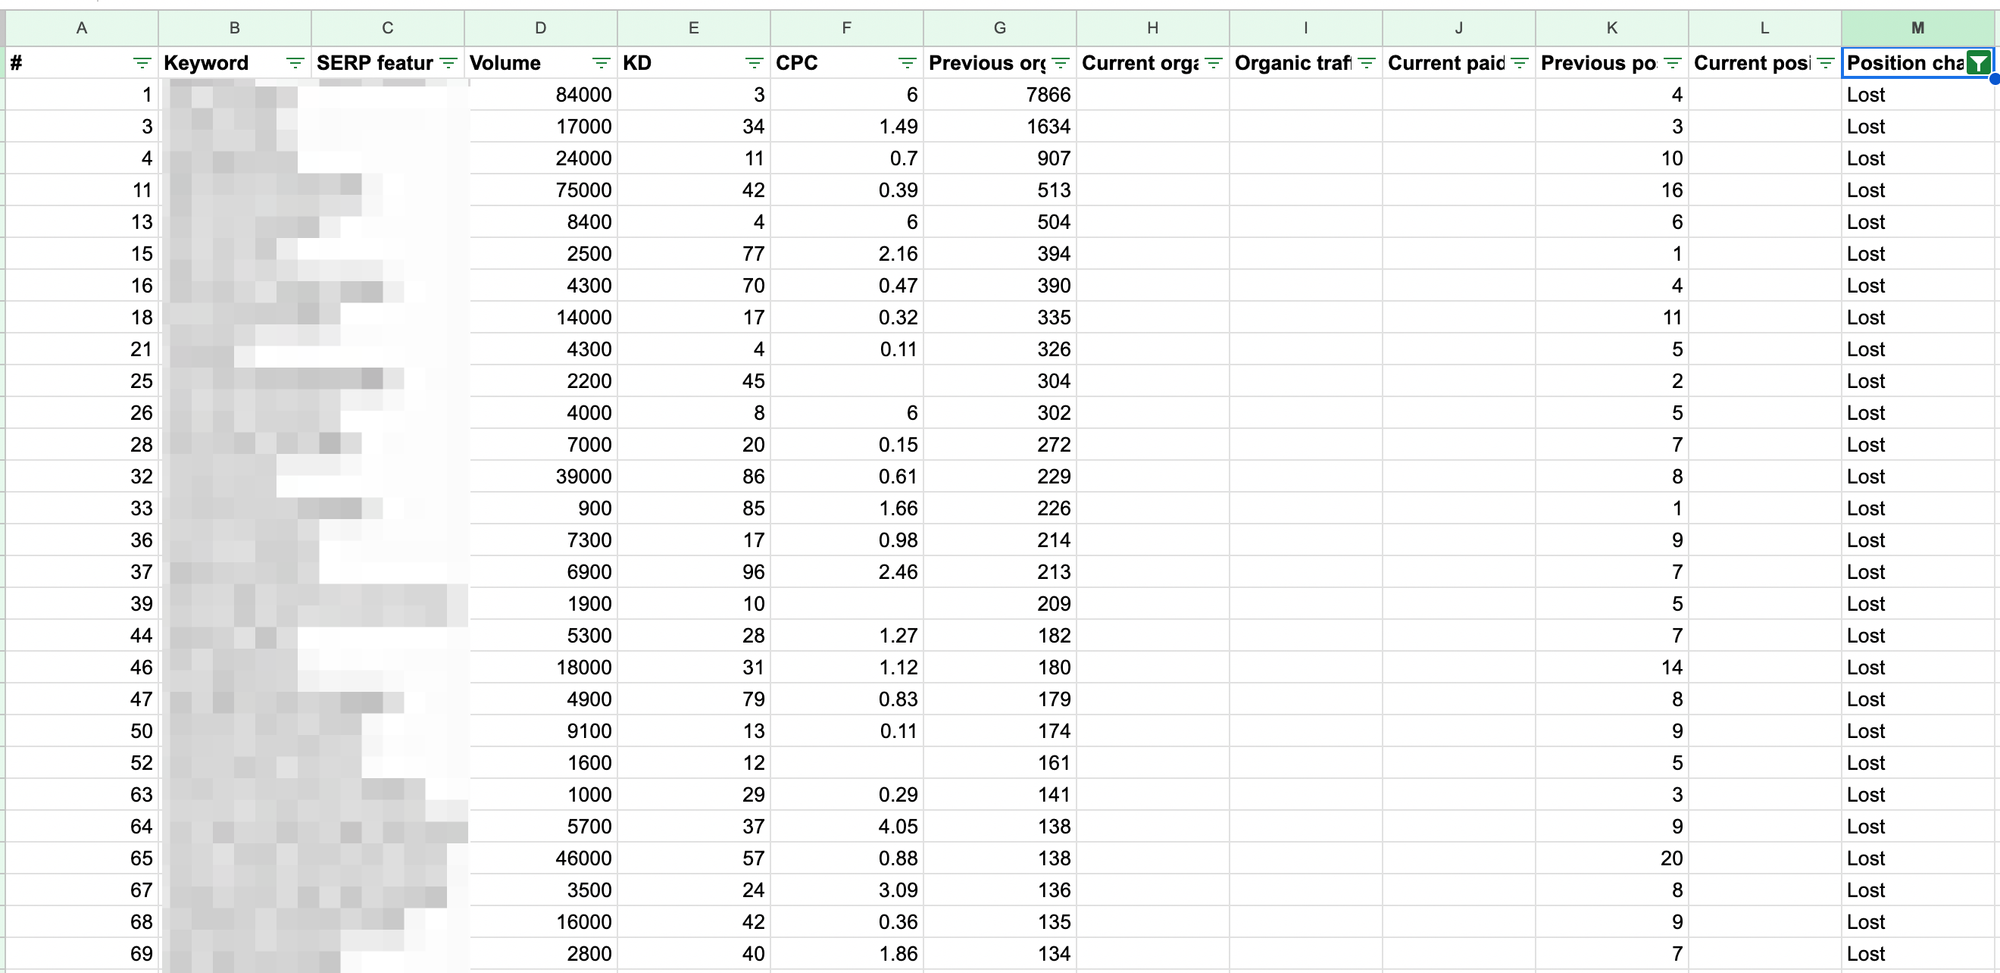
In the case of this site, 374 of the top 1000 driving keywords from the previous time period have been lost, representing an estimated 37%. We'll represent this value as 0.37.
Next, we'll pull the average keyword competitiveness across those top 1000 traffic-driving keywords. Turn off the 'Position Change' filter and take the average of all of the keywords in Column E (KD). We come out with an average keyword difficulty score of 22, which we'll represent as 0.22.
We end up with the following as a range of likelihoods of full recovery:
Conservative Traffic Reclamation Scenario: 15.65%
Moderate Traffic Reclamation Scenario: 23.75%
Optimistic Traffic Reclamation Scenario: 31.85%
Example #2
Let's take another example: a site that I believe is also higher-up on the YMYL scale (pregnancy and parenting), but that's had a far less pronounced decline over the last year than our last example, with not nearly as many Keyword Total Losses (which signifies the site is likely still considered highly relevant and helpful in its vertical)

For this site, the variables were:
-17% drop in YoY traffic (S=0.17)
-Keyword losses representing 6% (L=0.06)
-An average keyword competitiveness score of 35 (C=0.35)
-Domain authority score of 80 (DA=0.80)
For this site the ranges look like:
Conservative Traffic Reclamation Scenario: 48.15%
Moderate Traffic Reclamation Scenario: 51.55%
Optimistic Traffic Reclamation Scenario: 54.95%
Comparing the three scenarios between these two sites, this site is not only over 3x as likely to achieve a full recovery, but even the most conservative estimate has this site far more likely to reclaim its traffic than site #1. Site 2 lost a far smaller amount of aggregate traffic, including fewer Total Keyword Losses, and despite targeting more competitive keywords than Site 1, it has a far higher Domain Authority score.
Caveats and Limitations of this Model
I want to note a few other points of reference, including the limitations of this model (of which there are many!):
-To state the obvious: there isn't a straight-line relationship between these four data points and recovery. As with Search in general, many factors not listed here also play a role in ranking and re-ranking. This is a very basic model intended for ease of use, and directional accuracy is what we're aiming for here, rather than perfection.
-The 0.50 baseline included here represents a neutral starting point - between full and no recovery - to prevent wild predictions in either direction. One obvious drawback is that this assumes recovery rates for websites in every vertical are created equal. The truth is that it's usually more challenging to recover traffic in more competitive fields like YMYL. Because of that, if you're doing this for a site in health, finance, or a related topic, you might want to consider lowering the base value to, say, 0.45 and see where you net out.
-The output represents a theoretical ceiling as far as a likelihood of recovery. But getting to that ceiling assumes two things: first, the correct diagnosis of issues and secondly, your ability to execute on them based on the time and resources you have available.
Final Takeaways
Recovering organic traffic after a traffic loss can be marked with uncertainty even for site owners and publishers in the best possible positions. By using this quantitative assessment along with the qualitative recovery scorecard in tandem, you should be able to get a clearer picture as to the road ahead for your site and whether it's worth the investment in time and effort.
Finally, if you have any questions or want to point out anything you think is broken or statistically unsound with the model, please get in touch!

