
A 10-Question Scorecard to Assess Your Site's Likelihood of Recovery From the Last Year of Google Algorithm Updates


2023 and 2024 have been some of the most tumultuous years on record when it comes to the global search landscape. The rise in AI-powered solutions on both sides of the business (search engines and publishers), has led to a very different approach to charting out best practices than even two or three years ago.
Publishers are increasingly frustrated. The outcry from smaller, independent ("niche") sites is well-known at this point and has arguably been bubbling to the surface for some time. Many of these sites have well-established testing methodologies in place. They aren’t just the kind of low quality, “made-for-Adsense” sites users complained about a decade ago.
The other thing I think is new this time is the coverage Google's results are getting from mainstream press outlets. It's happening at a rate I haven't seen since I started in the industry - and that's over 15 years now.
Several of Google's updates have proved to be especially punitive. Sites hit by September’s HCU still have not seen any measurable reclamation of traffic, despite many working around the clock to try and improve their content, although as I publish this (July of 2024) there have been some blips in a positive direction for some sites. Moreover, it's been difficult for many publishers and site owners to get a clear sense of which update they were hit by with so many of them happening months and sometimes weeks of one another.
There have been a whole host of posts out there published about recovery. But I decided to do something a little different.
I’ve put together a self-assessment and scorecard designed to help give you a better sense of your likelihood of recovery based on a number of factors, both internal and external. Anyone who owns or operates a website (or is responsible for its organic traffic in some way) should be able to use it. In particular, I think niche site owners and portfolio operators, who might be looking to assess recovery potential across multiple sites, will find it especially helpful.
Note that this isn't meant to replace a more in-depth audit and analysis of your site, which should form the basis for any recovery effort. This is just designed to get things moving in the right direction.
For each URL, answer the questions below to the best of your ability and add up the corresponding points for each question at the end. The lower the final score, the more likely/easier it will be to recover.
All of the data here should be able to be surfaced through Google Analytics (or whatever equivalent you're using), Google Search Console as well as 3rd party SEO tools like Ahrefs or SEMRush.
You can also find a publicly downloadable link to the questionnaire here via Google Docs.

Scorecard Questions
1: How big is your site/brand (as measured by Domain Authority?)
- 80 or higher DA (1 point)
- 50-79 DA (2 points)
- 11-50 DA (3 points)
- 10 or less DA (4 points)
Why it's important: Besides the self-evident SEO value inherent in higher domain authority, for recovery purposes, it's far more likely a bigger, more authoritative site will find it easier to recover traffic than one with marginal levels of authority. It's also less likely that they're going to be hit by one of the more punitive algorithm updates (e.g. last September's HCU). While DA (as measured by 3rd party tools like Ahrefs and SEMRush) is by no means perfect, the signals those tools collect to render their DA scores are typically the same ones Google uses.
- Which Algo Update Was Your Site Most Affected By? (If you were negatively affected by multiple updates, choose each one and add up your score)
- August ‘23 Core (2 points)
- October ‘23 Core (2 points)
- March ‘24 Core (2 points)
- HCU(x) - September '23 (5 points)
Why it's important: Some of these updates were more punitive than others, which is why each update is weighted differently. It's well-documented that as of this publication, there have been no publicly available case studies of sites that have recovered since the HCU(x), despite public statements from Google representatives saying recovery is still possible. So that's why it has a much higher score. Note: if you suspect you've been hit by a Core Update but you don't know which one, add 2 points to your score and move on. Don't overthink it.
- How Much Traffic Have You Lost Since Last Year?
- Less than 10% (1 point)
- 10-30% (2 points)
- 31-50% (3 points)
- 50-79% (4 points)
- 80% or more (5 points)
Why it's important: Stating the obvious, it's going to be far more difficult to climb back up the mountain after a 95% drop in traffic than, say, a 30-40% drop. Larger drops in traffic are also more likely to represent a more systemic content quality issue, rather than just a lower quality section of content here or there.
- How does your website primarily make money?
- A product or service you sell directly (1 point)
- Products or services you sell on behalf of another merchant as an affiliate (2 points)
- Display ads (3 points)
Why it's important: This might seem like a superfluous question. Why would it matter what the business model of my website is? The reason: since late last year, keywords dominated historically by review-oriented sites have started to shift back towards retailers and service providers. In other words, sites that have a product or service to sell appear to have a competitive edge over affiliate sites who've historically acted as middlemen between consumers and products. Note: if you monetize through a combination of affiliate + display, pick the monetization model that either you emphasize the most on your website OR that generates the most revenue for you.
- Which scenario best describes the loss of visibility with respect to your target (and non-target) keywords?
- The bulk of my pages have lost a handful of positions here and there for my target keywords (1 point)
- The bulk of my pages have lost 10-20 spots and/or have fallen off the first page of Google (3 points)
- The bulk of my pages are no longer ranking at all for my target keywords. They’ve fallen off not just the first page but the entire top 100. (5 points)
Why it's important: I've seen a similar pattern with sites that have been in a sustained decline, particularly since last year, where they aren't just losing spots here and there or being shuffled off the first page onto pages two or three. But they're losing visibility entirely. Google's not showing the page at all for the keyword. That's a tell-tale sign that Google no longer finds your content helpful for that term. You may find that even though Option 3 fits your situation, that you do still rank for some terms, just lower than you had previously. I would still go with option 3 if that applies to you.

- How large is the site in terms of total published pages?
- Less than 20 pages (1 point)
- 20-50 pages (2 points)
- 50-100 pages (3 points)
- 100-500 pages (4 points)
- 500 or more pages (5 points)
Why it's important: This and the subsequent question are related. One of the biggest factors in recovery is the amount of content rewrite work involved, combined with your (or your team's) ability to tackle it.
Perhaps your site has a small number of pages that are lengthy and need a lot of content edits, images/video that needs to change, etc. But I would argue that's the exception to the rule. For most people, the barometer is the aggregate total number of pages themselves that need work. The bigger your site, the more pages are more likely "unhelpful," and the more uphill the battle.
- Let's say you started recovery efforts tomorrow. Over the course of the next month, roughly how many content pages (as a percentage of your overall site size) do you think you realistically could re-write?
- 100% of pages (1 point)
- 51-75% of pages (2 points)
- 25%-50% of pages (3 points)
- 11-24% of pages (4 points)
- 10% of less of pages (5 points)
Why it's important: If you're not sure of the most appropriate answer here, consider:
-How long it's taken you in the past to re-write content
-What resources you're currently working with. E.g. Are you a solo operator, have an otherwise small team or have competing priorities? If so, recovery will obviously take longer. However, if you have a larger team or can hire an agency to functionally throw more resources at the problem, you can speed the timeline up considerably.
- What are the sites that are now typically ranking for your target keywords?
- The same category of sites ranking as before my loss in traffic (1 point)
- Different categories of sites ranking compared to before my loss in traffic (2 points)
- .gov or .edu sites ranking (3 points)
Why it's important: What we're trying to assess here is whether or not there's been a shift in the kind of sites Google's choosing to surface for a given set of keywords. For example, publishers in a niche sometimes create company pages in bulk that all follow a certain formula. Law firms do this all the time within their areas of practice. Attorneys who specialize in debt collection may write content pages about different debt collection companies in the hopes that they rank highly and that a small percentage of that traffic might be interested in legal representation. If, suddenly, all of those law firm sites are replaced in the SERPs for those keywords by other sites? That's a tell-tale sign that Google, on balance, doesn't find that category of sites helpful to the user. This means recovering traffic for those terms is far less likely than if you were being replaced by a site belonging to the same category you do.
- What percentage of your overall search traffic consists of traffic from branded keywords?
- 80% or more (1 point)
- 50-79% (2 points)
- 31-50% (3 points)
- 10-30% (4 points)
- Less than 10% (5 points)
Why it's important: Evidence has mounted for years that Google uses brand strength signals in some fashion, whether it's a direct ranking factor or not. One of the ways to measure brand strength: how often people search directly for your brand. If you don't have a lot of brand volume, it's more likely that Google sees you as "writing content just for search engines", as explained in the Helpful Content Update documentation. (Note: if you're not sure, add one point to your score and move on to the final question)
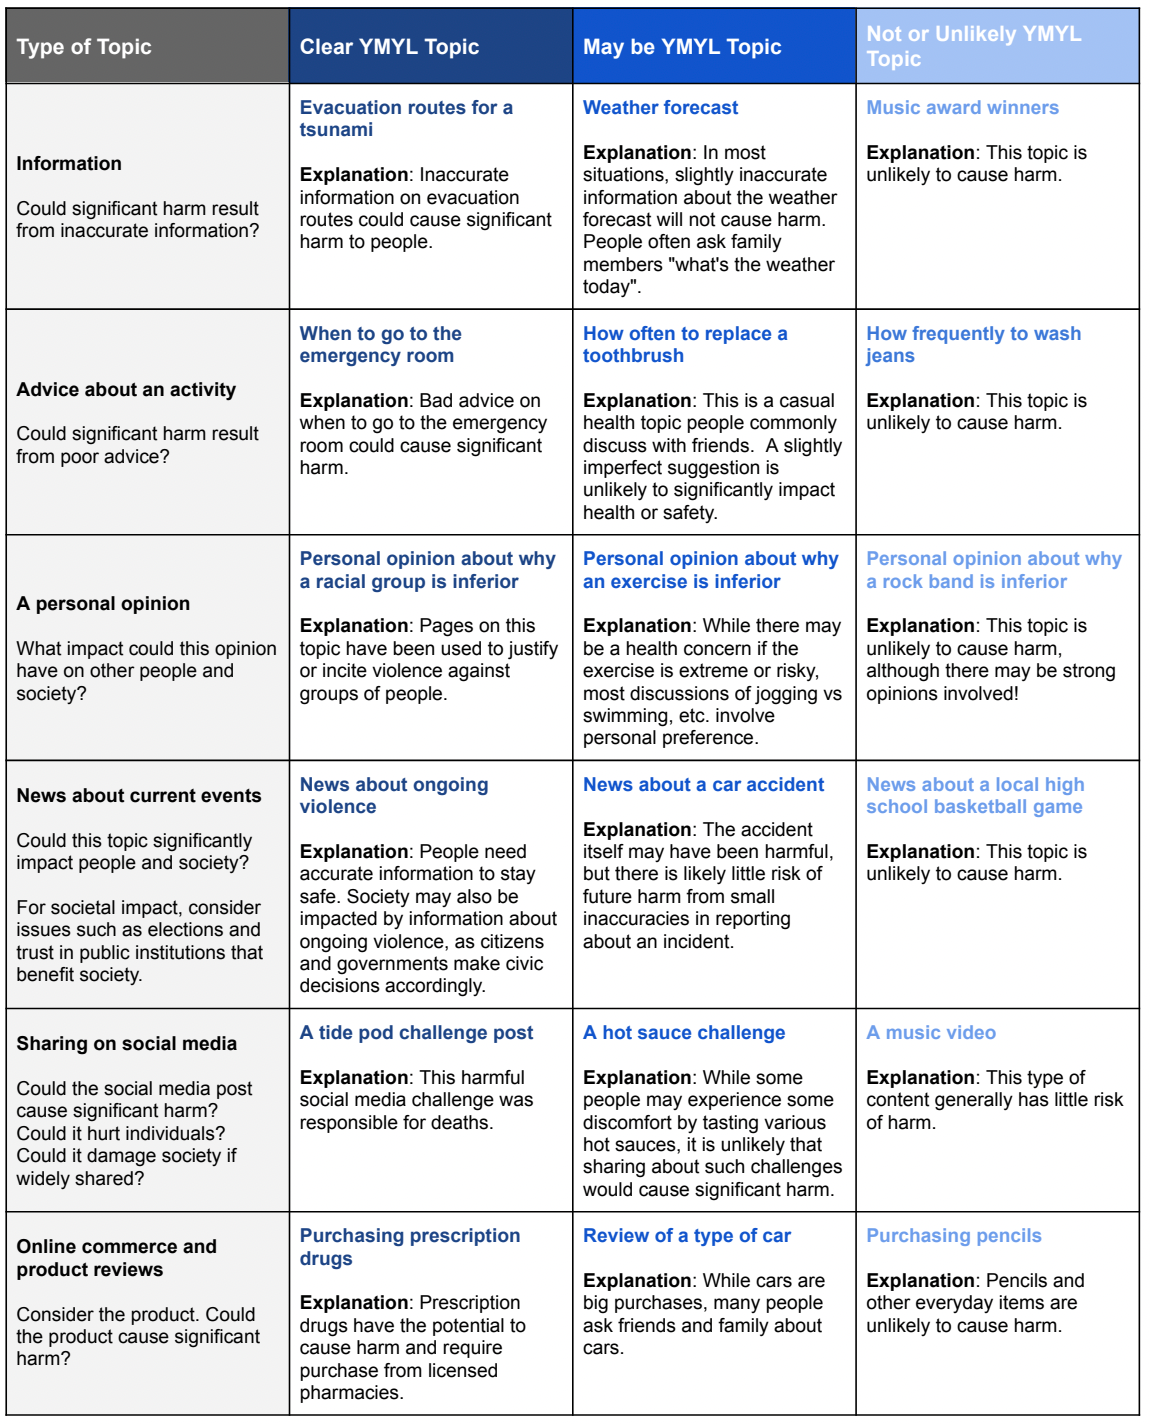
- Where does the majority of your content sit along the YMYL spectrum?
- Not or unlikely to be YMYL (1 point)
- May be YMYL (3 points)
- Clear YMYL (5 points)
Why it's important: To review, sites that produce "Your Money or Your Life" content are held algorithmically (and by quality raters) to a higher standard for accuracy, authenticity and E-E-A-T. The farther you are into YMYL territory, the more difficult it's likely going to be to regain your traffic. Use the chart below (from page 12 of Google's Quality Raters Guidelines document) as a way to gauge where your own content sits on the YMYL spectrum.
What I Left Out
The questions here focus on top-line metrics and signals that site owners can see at a glance. I purposefully didn't include things that would require a deeper dive into a site's content, link and technical situation. For example, the next step of any kind of serious recovery audit would be to dive into a site's content to determine:
• Of the content that exists, how much of it might reasonably be deemed "unhelpful" (based on Google's guidance as well as what the competitive landscape looks like, etc.)
• A plan for either improving the content or pivoting away from it (e.g. a pruning exercise or large-scale noindex efforts)
Another question I decided to leave off of this scorecard (but might still be worth asking yourself) is: how big a percentage of your overall site traffic is attributable to organic search? Does organic account for the majority of your site's traffic? Or is it more diversified? (E-mail, social, etc.)
There's been public chatter around the fact that some of the declines tend to be from sites that over-relied on unbranded SEO traffic (with little to no brand search) or visits to their site from channels other than SEO. That maybe they were hit harder than those who had a more diverse set of channels driving traffic to their website.
However, Cyrus Shepard of Zyppy looked into this specifically and found the data to be inconclusive with respect to whether sites that relied (or perhaps over-relied) on Google traffic for the majority of visits were somehow targeted specifically. So for the purposes of the scorecard, I left this question off. That said, as most of us know, the more your brand and business rely on any one channel for visitors (particularly a channel subject to a lot of algorithmic flux like Google organic search), the riskier your position, as opposed to businesses with a more diversified traffic picture between sources like direct, social, e-mail, etc.
Final Takeaways
My hope is that this exercise gives you, the reader, at least a broad sense of what it might take to recover traffic for your web site. You can then make the business decision to go deeper and map out a more detailed plan of attack: either tackling it yourself or with the help of a capable SEO professional. Or, worst case scenario, you might decide that, given the Search landscape and whatever resources are available to you at the moment, a site might not be worth salvaging, which may be hurtful to hear. But imminently better, I would argue, then throwing good money after bad trying to recover a site where the juice might not be worth the squeeze in terms of time spent vs. traffic/conversion/revenue.
Thanks to Cyrus Shepard, Vlad Rappoport and Marie Haynes for reading drafts of this piece and sharing valuable feedback to make it better!